![]()
![]()

Meteorologists gather information about the weather from satellites, balloons, and other instruments. Powerful computers help them to analyze the data. Using this information, meteorologists draw weather maps. These can show the state of the weather at any one time, or they can be a forecast of weather in the future. The maps use symbols to represent conditions such as rainfall and wind direction.
You can set up your own weather station to record daily conditions with a few simple devices. You will be able to use some of the instruments you have made in the other projects, such as the weather vane, hygrometer, and rain gauge. You will also need to buy a thermometer to measure the temperature. Take measurements with your weather instruments every day. Write them down in a special weather book. Also, make a note of what the weather is like in general – fine, cloudy, drizzly, frosty, and so on. Don’t forget to make a note of the date!
 Forecasting rain
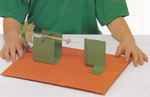
A hygrometer will gauge the amount of moisture in the air. When the pointer tilts up on the scale, the air is moist and rain may be on the way.
 Measuring rainfall
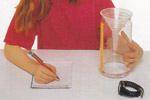
A rain gauge will tell you how much rain has fallen. Rainfall is collected over a set period in a jar or measuring bottle, and the amount is recorded.
Wind direction
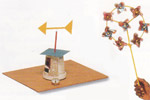 A windmill shows how hard the wind is blowing. A weather vane will tell you the wind’s direction. The arrow points in the direction that the wind is blowing from. So if the arrow points west, the wind is a west wind.
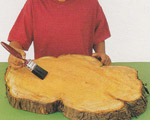
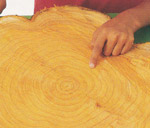
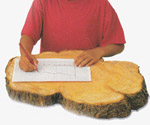
Newly cut log, decorating paintbrush, ruler with 1/16in measurements, metric graph paper, pen or pencil.
Try out the other sections
 Parents' Day
 Craft Ideas for Kids
 School Projects & Homework Help
 Hobbies
